Difference between revisions of "ProDon:Analysis Grid"
Kplamondon (talk | contribs) |
Kplamondon (talk | contribs) (Tag: Visual edit) |
||
| Line 11: | Line 11: | ||
In this example, the grid is created in the transaction history.. | In this example, the grid is created in the transaction history.. | ||
| − | {| | + | {| |
|Go to the "Analysis" menu, then "History", and finally "Transactions". | |Go to the "Analysis" menu, then "History", and finally "Transactions". | ||
|- | |- | ||
| Line 18: | Line 18: | ||
|width="50%" |<span style="color: rgb(255, 0, 0);">'''A :'''</span> Click [[File:Button Analysis Grid 001.png|frameless|20x20px]] to view the detailed grid and access the analysis grid. | |width="50%" |<span style="color: rgb(255, 0, 0);">'''A :'''</span> Click [[File:Button Analysis Grid 001.png|frameless|20x20px]] to view the detailed grid and access the analysis grid. | ||
|} | |} | ||
| − | {| | + | {| |
|[[File:Analysis Grid 002.png|frameless|1068x1068px]] | |[[File:Analysis Grid 002.png|frameless|1068x1068px]] | ||
|- | |- | ||
| Line 24: | Line 24: | ||
|} | |} | ||
{| class="wikitable" | {| class="wikitable" | ||
| − | |Upon clicking [[File:Mini Button Analysis Grid 001.png|frameless|20x20px]] , this window will appear: | + | |Upon clicking [[File:Mini Button Analysis Grid 001.png|frameless|20x20px]], this window will appear: |
|- | |- | ||
|[[File:Analysis Grid 003.png|201x201px]] | |[[File:Analysis Grid 003.png|201x201px]] | ||
| Line 30: | Line 30: | ||
|Select the desired function to add, modify, or delete an analysis grid. | |Select the desired function to add, modify, or delete an analysis grid. | ||
|} | |} | ||
| + | |||
{| class="wikitable" | {| class="wikitable" | ||
| colspan="2" |Selecting "Add analysis grid" opens this window: | | colspan="2" |Selecting "Add analysis grid" opens this window: | ||
| Line 42: | Line 43: | ||
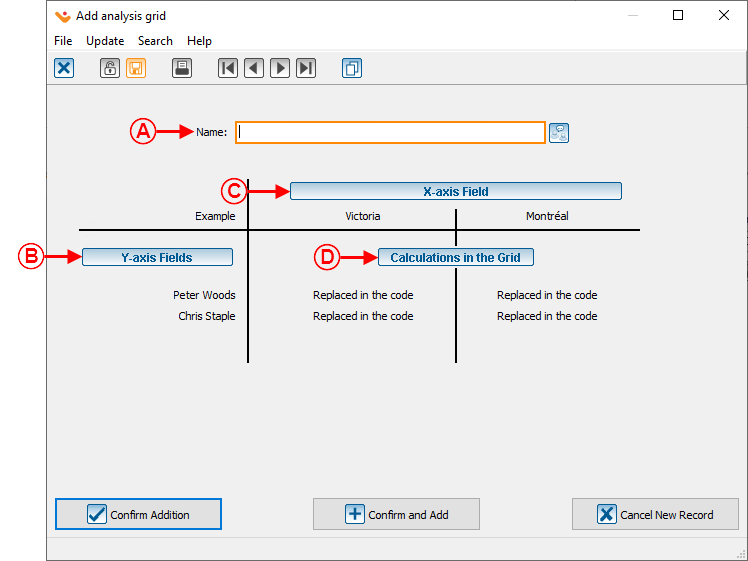
|<span style="color: rgb(255, 0, 0);">'''C :'''</span> Allows to define the field(s) that will be on the Y-axis | |<span style="color: rgb(255, 0, 0);">'''C :'''</span> Allows to define the field(s) that will be on the Y-axis | ||
|<span style="color: rgb(255, 0, 0);">'''D :'''</span> Allows to configure the calculation(s) within the grid. | |<span style="color: rgb(255, 0, 0);">'''D :'''</span> Allows to configure the calculation(s) within the grid. | ||
| + | |} | ||
| + | {| class="wikitable" | ||
| + | |Clicking [[File:Button X-axis Analysis Grid 001.png|frameless|332x332px]], | ||
| + | |||
| + | opens this window: | ||
| + | |- | ||
| + | |[[File:Analysis Grid 005.png|436x436px]] | ||
| + | |- | ||
| + | |<span style="color: rgb(255, 0, 0);">'''A :'''</span> Choose the desired field for the X-axis. | ||
| + | |} | ||
| + | {| class="wikitable" width="200" cellspacing="1" cellpadding="1" border="1" | ||
| + | | colspan="2" |Clicking [[File:Button Y-axis Analysis Grid 001.png|frameless|151x151px]], opens this window: | ||
| + | |- | ||
| + | | colspan="2" |[[Fichier:Prodon5 Grille d'analyse 006.png|centre|frameless|564x564px|link=http://wikifr.logilys.com/index.php/Fichier:Prodon5_Grille_d'analyse_006.png]] | ||
| + | |- | ||
| + | | width="50%" |<span style="color: rgb(255, 0, 0);">'''A :'''</span> Permits the reordering of fields. | ||
| + | | width="50%" |<span style="color: rgb(255, 0, 0);">'''B :'''</span> Allows to add, modify, or remove a field from the Y-axis. | ||
|} | |} | ||
Revision as of 18:25, 26 September 2024
| Analysis Grid |
Prodon:Table of Contents
CAUTION : This document is for VERSION 5 of Prodon. To go to the document for version 4, click here.
WARNING : This document is currently being edited/revised, it is possible that some parts are missing or obsolete.
Introduction
Analysis grids can be configured within various management screens in Prodon. To access the necessary data for a specific analysis, simply navigate to the relevant management screen.
This allows for both simple data extraction and cross-analysis.
Analysis grid configuration
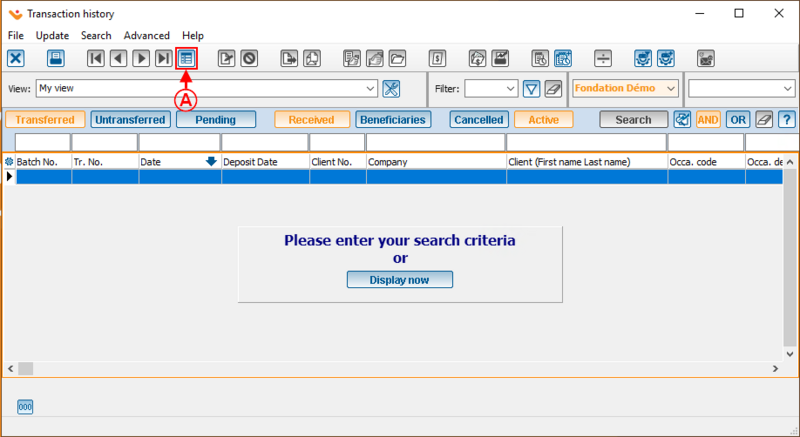
In this example, the grid is created in the transaction history..
| Go to the "Analysis" menu, then "History", and finally "Transactions". |

|
| A : Click |

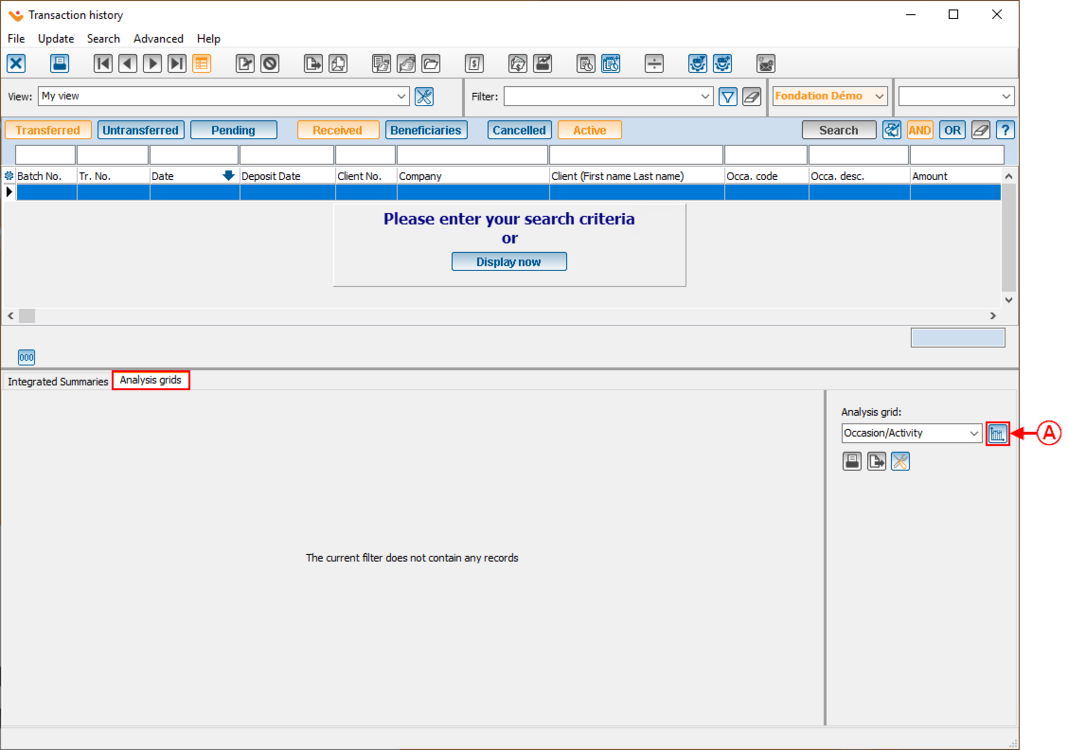
|
| A : Click |
| Upon clicking |

|
| Select the desired function to add, modify, or delete an analysis grid. |
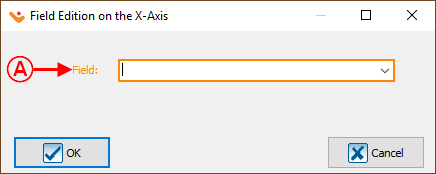
| Clicking opens this window: |

|
| A : Choose the desired field for the X-axis. |
| Clicking | |
| centre|frameless|564x564px|link=http://wikifr.logilys.com/index.php/Fichier:Prodon5_Grille_d'analyse_006.png | |
| A : Permits the reordering of fields. | B : Allows to add, modify, or remove a field from the Y-axis. |
