Difference between revisions of "ProDon:Analysis Summary"
| Line 18: | Line 18: | ||
The summaries are always calculated based on the active list. The active list is the result of a search or a filter. For instance, if you want to compare the information of several editions of golf tournaments, you will first have to conduct a search, this way allowing you to view, onscreen only, the transactions attached to one of the golf tournaments. It is possible to search using the search bar or by making a filter.<br> | The summaries are always calculated based on the active list. The active list is the result of a search or a filter. For instance, if you want to compare the information of several editions of golf tournaments, you will first have to conduct a search, this way allowing you to view, onscreen only, the transactions attached to one of the golf tournaments. It is possible to search using the search bar or by making a filter.<br> | ||
| − | When the search is done, click on the [[Image: | + | When the search is done, click on the [[Image:Button Summary detail.png]] button to display the summaries. |
| − | |||
| + | <br> | ||
{| width="50%" cellspacing="1" cellpadding="1" border="1" class="wikitable" | {| width="50%" cellspacing="1" cellpadding="1" border="1" class="wikitable" | ||
|- | |- | ||
| colspan="2" | | | colspan="2" | | ||
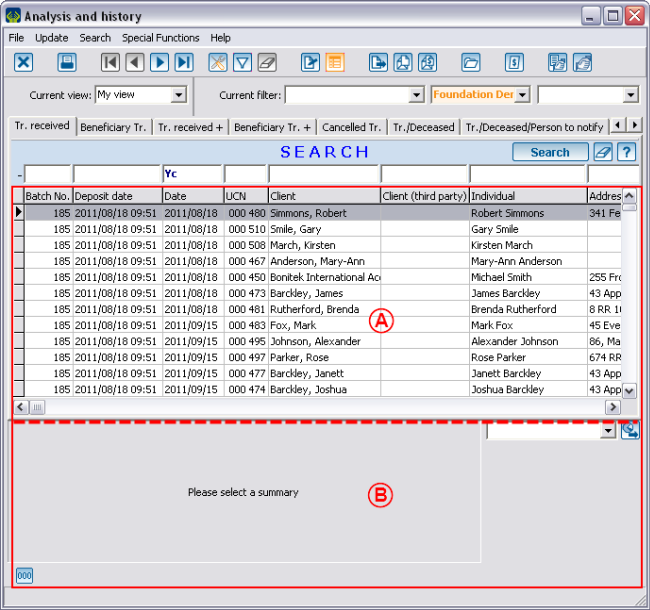
| − | After clicking on the [[Image: | + | After clicking on the [[Image:Button Summary detail.png]] button, the window splits into two sections. |
|- | |- | ||
| − | | colspan="2" | <br> | + | | colspan="2" | [[Image:Analysis_Summary_001.png]]<br> |
|- | |- | ||
| − | | width="50%" | < | + | | width="50%" | |
| − | | width="50%" | < | + | '''<span style="color: rgb(255, 0, 0);">A: </span>'''The top part contains the active list. |
| + | |||
| + | | width="50%" | | ||
| + | '''<span style="color: rgb(255, 0, 0);">B: </span>'''The bottom part allows you to select the analysis summary. | ||
| + | |||
|} | |} | ||
Revision as of 15:36, 23 August 2011
Contents
Introduction
The "Analysis and history" management contains all the transacions of the database. It is common to want to highlight information for analysis purposes. Many of these analyses are possible thanks to the summaries available. For example:
- How many different clients were there for the 1,000 transactions of a targeted donation occasion?
- What is the distribution per city of these 1,000 transactions?
- What is the total amount of all the transactions of a targeted year?
- ...
Viewing Summaries
The summaries are always calculated based on the active list. The active list is the result of a search or a filter. For instance, if you want to compare the information of several editions of golf tournaments, you will first have to conduct a search, this way allowing you to view, onscreen only, the transactions attached to one of the golf tournaments. It is possible to search using the search bar or by making a filter.
When the search is done, click on the ![]() button to display the summaries.
button to display the summaries.
|
After clicking on the | |
 | |
|
A: The top part contains the active list. |
B: The bottom part allows you to select the analysis summary. |
| | |
| | |
| |
|
| |
|
| | |
| | |
| |
|
Exporting Summaries to Excel
"Summaries" Tab
| | |
| | |
| |
|
| |
|
"Columns" Tab
| | |
| |
|
| | |
"Cumulative periods" Tab
"Options" Tab
Excel Functions on Summaries
Document name: ProDon:Analysis Summary