Difference between revisions of "ProDon:Custom Reports"
(→Introduction) |
|||
| Line 50: | Line 50: | ||
Go in the management associated to the type of report you want to create. | Go in the management associated to the type of report you want to create. | ||
| − | Conduct a search by criterion using the search bar, so that the management grid corresponds to what should be found on the report. | + | Conduct a search by criterion using the search bar or a filter, so that the management grid corresponds to what should be found on the report. |
Once the management grid corresponds to what should be found on the report, click on the [[Image:Button Print Report.png]] button. | Once the management grid corresponds to what should be found on the report, click on the [[Image:Button Print Report.png]] button. | ||
| Line 88: | Line 88: | ||
=== Configuration of the Visual Options === | === Configuration of the Visual Options === | ||
| − | {| cellspacing="1" cellpadding="1" border="1 | + | {| cellspacing="1" cellpadding="1" border="1" style="width: 506px; height: 440px;" class="wikitable" |
|- | |- | ||
| colspan="2" | | | colspan="2" | | ||
| Line 125: | Line 125: | ||
<br> | <br> | ||
| − | {| cellspacing="1" cellpadding="1" border="1 | + | {| cellspacing="1" cellpadding="1" border="1" style="width: 476px; height: 682px;" class="wikitable" |
|- | |- | ||
| colspan="2" | [[Image:Custom Reports 004.png]] | | colspan="2" | [[Image:Custom Reports 004.png]] | ||
| Line 190: | Line 190: | ||
|} | |} | ||
| − | <br> | + | <br> |
===== Second Example ===== | ===== Second Example ===== | ||
| Line 272: | Line 272: | ||
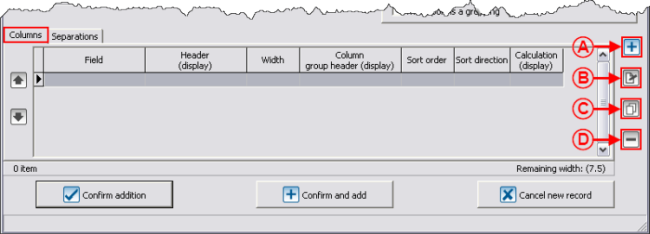
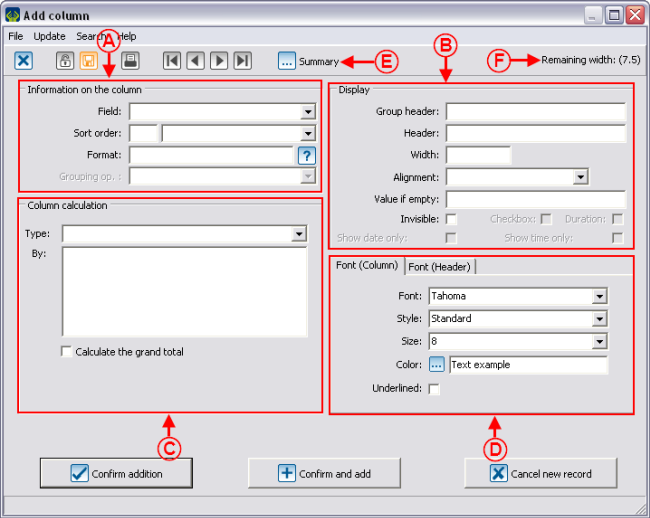
'''<span style="color: rgb(255, 0, 0);">D: </span>'''The "Font (Column)" tab allows you to choose the font to be used in the data lines. | '''<span style="color: rgb(255, 0, 0);">D: </span>'''The "Font (Column)" tab allows you to choose the font to be used in the data lines. | ||
| − | The "Font (Header)" allows you to choose the font to be used in the header line of the column. | + | The "Font (Header)" tab allows you to choose the font to be used in the header line of the column. |
|- | |- | ||
| Line 302: | Line 302: | ||
|- | |- | ||
| | | | ||
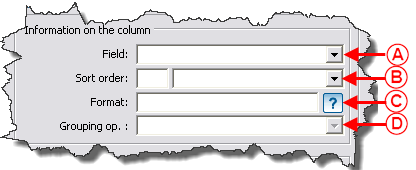
| − | '''<span style="color: rgb(255, 0, 0);">B: </span>'''Allows you to decide on the order in which the information is displayed. In the first box, you have to specify the sorting priority and in the second box, you have to specify whether it is an ascending or descending order | + | '''<span style="color: rgb(255, 0, 0);">B: </span>'''Allows you to decide on the order in which the information is displayed. In the first box, you have to specify the sorting priority and in the second box, you have to specify whether it is an ascending or descending order. |
<br> | <br> | ||
| Line 360: | Line 360: | ||
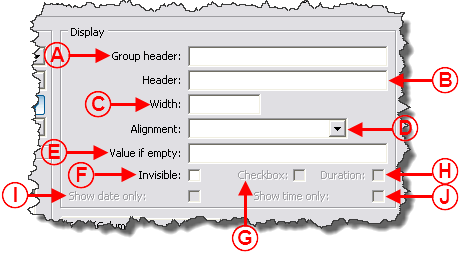
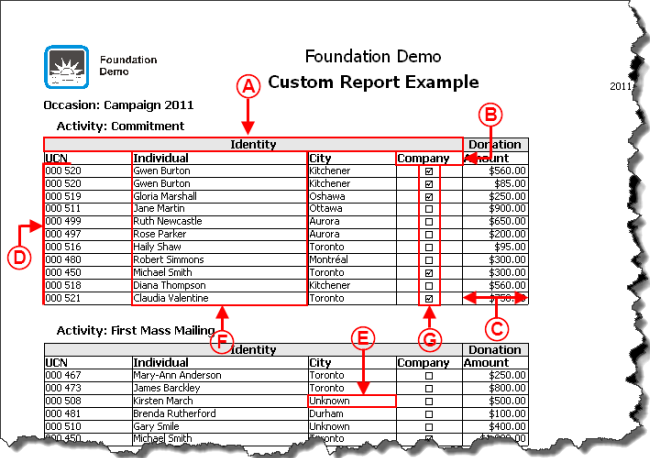
==== Display ==== | ==== Display ==== | ||
| − | {| cellspacing="1" cellpadding="1" border="1 | + | {| cellspacing="1" cellpadding="1" border="1" style="width: 515px; height: 529px;" class="wikitable" |
|- | |- | ||
| | | | ||
| Line 453: | Line 453: | ||
| width="50%" | | | width="50%" | | ||
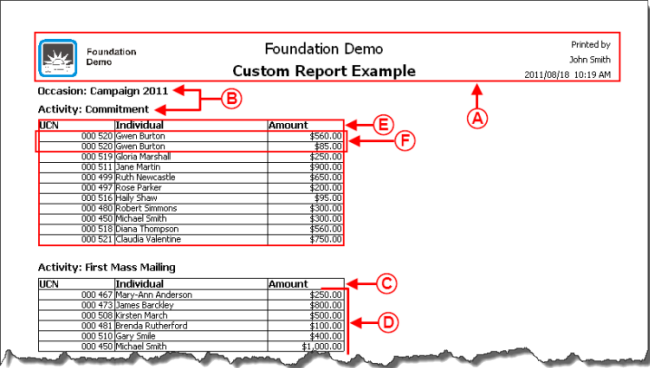
| − | '''<span style="color: rgb(255, 0, 0);">F: </span>'''The individuals are placed in alphabetical order of name, since the "Last name" field has been added, but it is invisible. If the field had not been added, the "Individual" column would have been placed in alphabetical order of first name. | + | '''<span style="color: rgb(255, 0, 0);">F: </span>'''The individuals are placed in alphabetical order of last name, since the "Last name" field has been added, but it is invisible. If the field had not been added, the "Individual" column would have been placed in alphabetical order of first name. |
|- | |- | ||
| Line 466: | Line 466: | ||
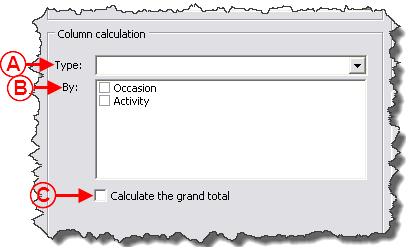
==== Column Calculation ==== | ==== Column Calculation ==== | ||
| − | {| cellspacing="1" cellpadding="1" border="1" style="width: 501px; height: 583px; | + | {| cellspacing="1" cellpadding="1" border="1" class="wikitable" style="width: 501px; height: 583px;" |
|- | |- | ||
| | | | ||
| Line 475: | Line 475: | ||
|- | |- | ||
| | | | ||
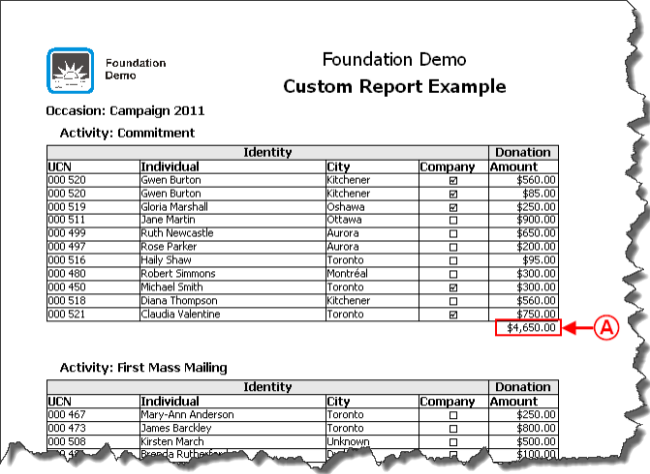
| − | '''<span style="color: rgb(255, 0, 0);">A: </span>'''Allows you to choose a mathematical operation in order to enter a result at the bottom of the column (e.g. the average of donations per person, the total of donations for an activity, the total of donations for an occasion, etc.) | + | '''<span style="color: rgb(255, 0, 0);">A: </span>'''Allows you to choose a mathematical operation in order to enter a result at the bottom of the column (e.g. the average of donations per person, the total of donations for an activity, the total of donations for an occasion, etc.). |
| + | |||
| + | '''NOTE: '''The mathematical operations available are based on the selected field. | ||
To view an example of column calculation, see letter '''<span style="color: rgb(255, 0, 0);">A</span>'''. | To view an example of column calculation, see letter '''<span style="color: rgb(255, 0, 0);">A</span>'''. | ||
| Line 531: | Line 533: | ||
|} | |} | ||
| − | <br> | + | <br> |
=== Adding Separations to the Report === | === Adding Separations to the Report === | ||
| Line 633: | Line 635: | ||
|} | |} | ||
| − | <br> | + | <br> |
=== Customized Value === | === Customized Value === | ||
| Line 641: | Line 643: | ||
For instance, instead of displaying the "Address", "City", "Province" and "Postal code" fields on four columns, it is possible to display these four pieces of information in a configurable value. | For instance, instead of displaying the "Address", "City", "Province" and "Postal code" fields on four columns, it is possible to display these four pieces of information in a configurable value. | ||
| − | {| cellspacing="1" cellpadding="1" border="1 | + | {| cellspacing="1" cellpadding="1" border="1" style="width: 501px; height: 295px;" class="wikitable" |
|- | |- | ||
| − | | | + | | style="text-align: center;" colspan="2" | [[Image:Custom Reports 021.png]] |
|- | |- | ||
| width="50%" | | | width="50%" | | ||
| Line 680: | Line 682: | ||
|} | |} | ||
| − | <br> | + | <br> |
=== Conditional Value === | === Conditional Value === | ||
| Line 688: | Line 690: | ||
For instance, if a client is anonymous, the mention "Anonymous" must appear in the column, otherwise the donor's name must be entered. | For instance, if a client is anonymous, the mention "Anonymous" must appear in the column, otherwise the donor's name must be entered. | ||
| − | {| cellspacing="1" cellpadding="1" border="1 | + | {| cellspacing="1" cellpadding="1" border="1" style="width: 508px; height: 490px;" class="wikitable" |
|- | |- | ||
| − | | | + | | style="text-align: center;" colspan="2" | [[Image:Custom Reports 024.png]] |
|- | |- | ||
| width="50%" | | | width="50%" | | ||
| Line 709: | Line 711: | ||
<br> | <br> | ||
| − | {| cellspacing="1" cellpadding="1" border="1 | + | {| cellspacing="1" cellpadding="1" border="1" style="width: 499px; height: 350px;" class="wikitable" |
|- | |- | ||
| − | | | + | | style="text-align: center;" colspan="2" | [[Image:Custom Reports 025.png]] |
|- | |- | ||
| width="50%" | | | width="50%" | | ||
| Line 755: | Line 757: | ||
<br> | <br> | ||
| − | {| cellspacing="1" cellpadding="1" border="1" style="width: 513px; height: 357px; | + | {| cellspacing="1" cellpadding="1" border="1" class="wikitable" style="width: 513px; height: 357px;" |
|- | |- | ||
| colspan="2" | | | colspan="2" | | ||
| Line 761: | Line 763: | ||
|- | |- | ||
| − | | style="text-align: center; | + | | colspan="2" style="text-align: center;" | [[Image:Custom Reports 027.png]] |
|- | |- | ||
| width="50%" | | | width="50%" | | ||
| Line 780: | Line 782: | ||
<br> | <br> | ||
| − | {| cellspacing="1" cellpadding="1" border="1" style="width: 495px; height: 329px; | + | {| cellspacing="1" cellpadding="1" border="1" class="wikitable" style="width: 495px; height: 329px;" |
|- | |- | ||
| style="text-align: center;" | [[Image:Custom Reports 028.png]] | | style="text-align: center;" | [[Image:Custom Reports 028.png]] | ||
| Line 802: | Line 804: | ||
|} | |} | ||
| − | <br> | + | <br> |
=== Calculation Function === | === Calculation Function === | ||
| Line 810: | Line 812: | ||
For instance, it is possible to take the "Amount" field and to multiply it by 0.10 to obtain a column that displays 10% of the value of the amounts of the transaction. | For instance, it is possible to take the "Amount" field and to multiply it by 0.10 to obtain a column that displays 10% of the value of the amounts of the transaction. | ||
| − | {| cellspacing="1" cellpadding="1" border="1" style="width: 474px; height: 284px; | + | {| cellspacing="1" cellpadding="1" border="1" class="wikitable" style="width: 474px; height: 284px;" |
|- | |- | ||
| − | | style="text-align: center; | + | | colspan="2" style="text-align: center;" | [[Image:Custom Reports 030.png]] |
|- | |- | ||
| width="50%" | | | width="50%" | | ||
| Line 826: | Line 828: | ||
{| width="50%" cellspacing="1" cellpadding="1" border="1" class="wikitable" | {| width="50%" cellspacing="1" cellpadding="1" border="1" class="wikitable" | ||
|- | |- | ||
| − | | style="text-align: center; | + | | colspan="2" style="text-align: center;" | [[Image:Custom Reports 031.png]] |
|- | |- | ||
| width="50%" | | | width="50%" | | ||
| Line 854: | Line 856: | ||
|} | |} | ||
| − | <br> | + | <br> |
=== Using the Option "This report is a grouping" === | === Using the Option "This report is a grouping" === | ||
Revision as of 12:00, 29 September 2011
Contents
[hide]- 1 Introduction
- 2 Managing the Reports Available
- 3 Creation of a Custom Report
Introduction
The "Custom reports" tool allows you to create reports from a search previously conducted.
Firstly, it is important to know that:
- It is possible to create a custom report from all the management grids in which the report icon
 is active (blue).
 - A report is always attached to a precise management grid. For instance, if it is created in the "Transaction management", it does not appear in the "Client management".
- The fields available for the creation of a report are the same as the ones in the corresponding management grid (columns).
- It is possible to include summaries to the reports only from the "Client management" and "Analysis and history".
- Each management grid contains lines of specific information (e.g. the clients in the "Client management" grid and it is possible to generate an existing report from each of these files, the transactions in "Analysis and History") However, it is not possible to create a new one.
Managing the Reports Available
First of all, go in the management associated to the type of report you want to create, modify or delete.
|
This window opens. | |
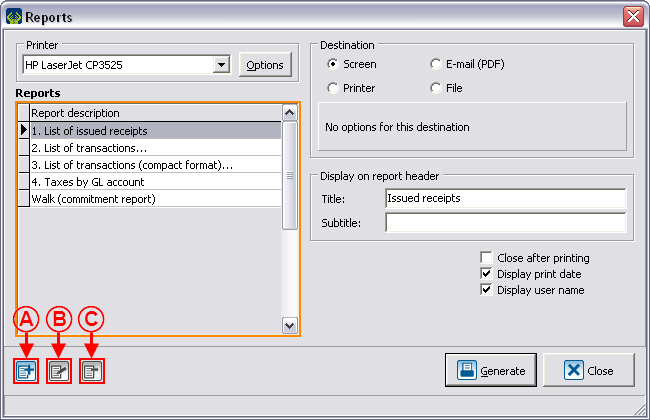
| |
|
NOTE: The reports provided by Logilys are not modifiable nor deletable. | |
Creation of a Custom Report
Go in the management associated to the type of report you want to create.
Conduct a search by criterion using the search bar or a filter, so that the management grid corresponds to what should be found on the report.
Once the management grid corresponds to what should be found on the report, click on the ![]() button.
button.
To create a new report, click on the ![]() button.
button.
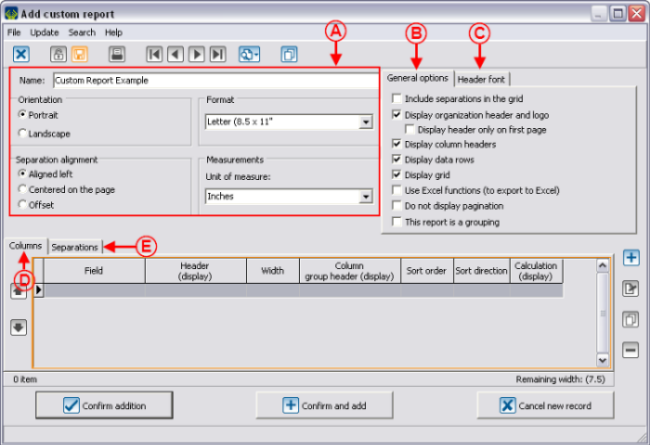
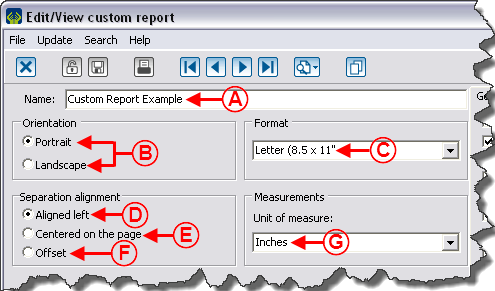
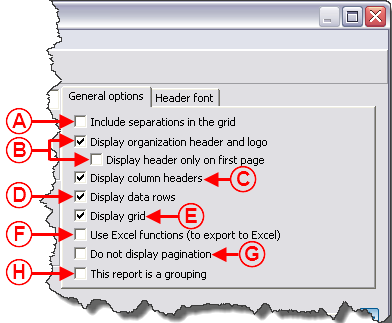
Configuration of the Visual Options
Examples of Visual Options
First Example
Second Example
Third Example
 | |
|
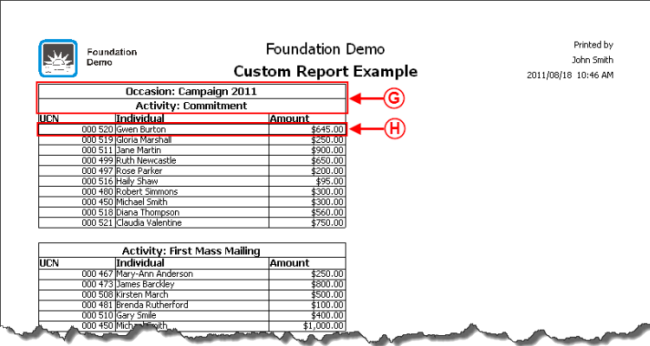
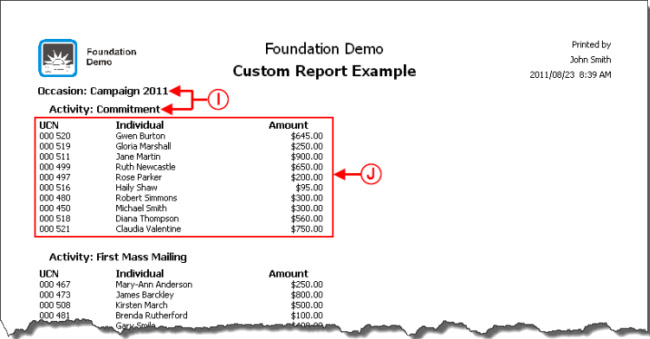
I: Example of report where the separations are offset. |
J: Example of report where the option "Display grid" is not checked. |
Adding Columns to the Report
Information on the Column
Display
Examples of Display
Column Calculation
Example of Column Calculation
Adding Separations to the Report
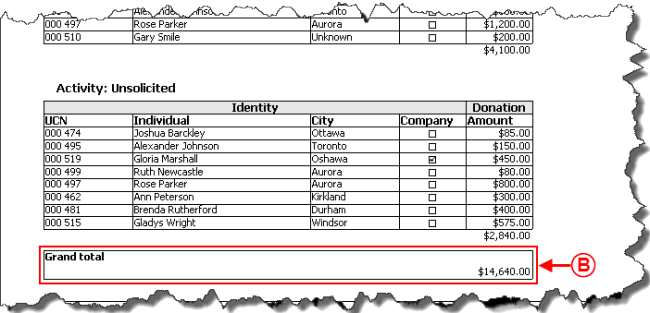
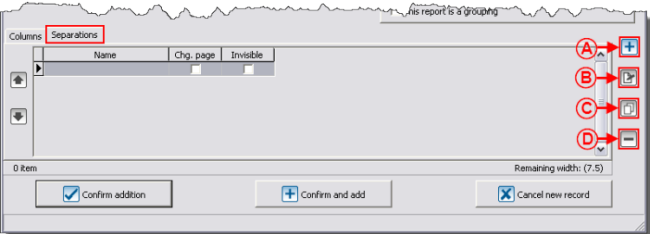
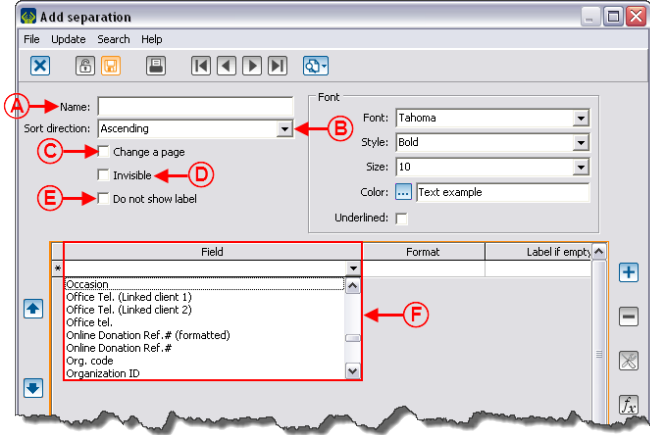
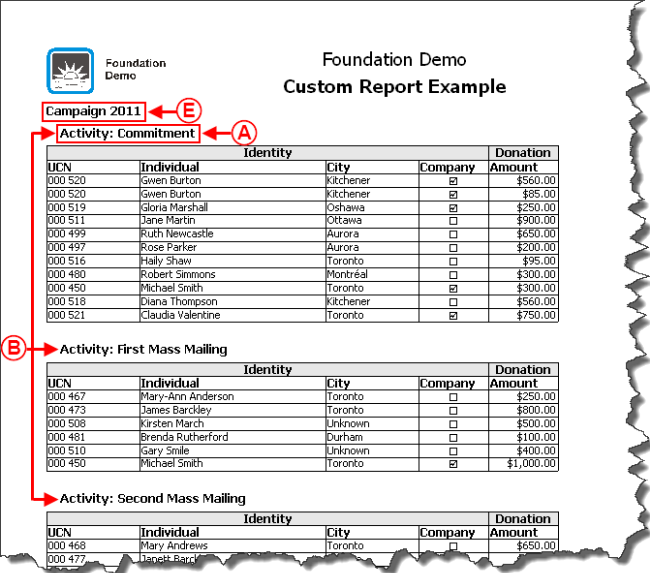
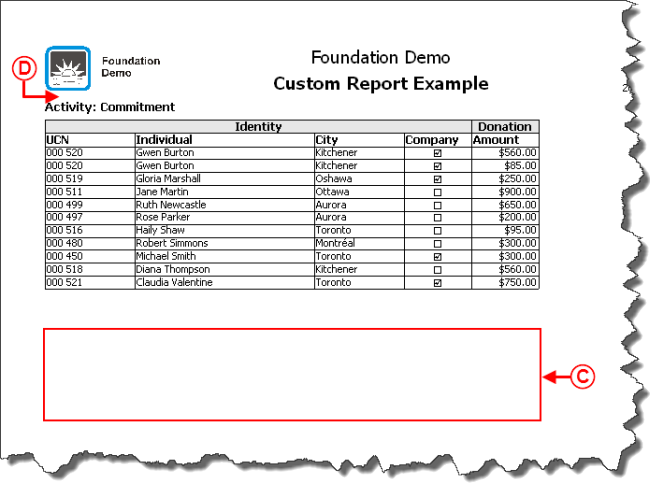
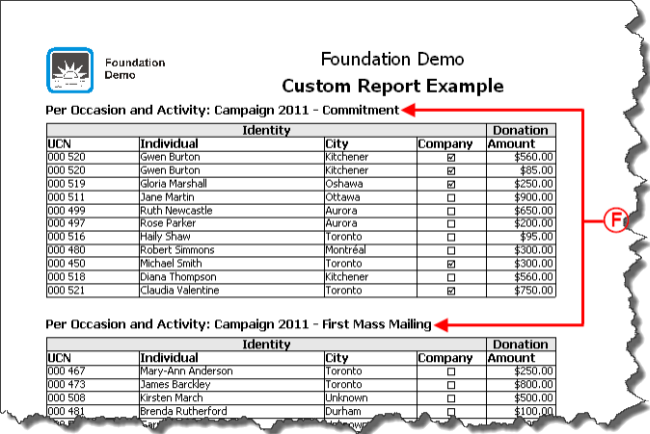
Adding separations allows you to section the report based on a specific piece of information. The sectioning is done each time the report encounters a new piece of information.
Examples of Separations
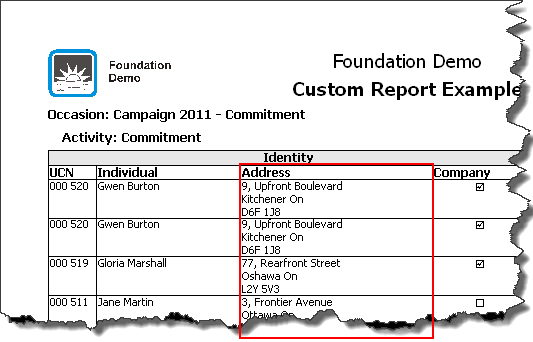
Customized Value
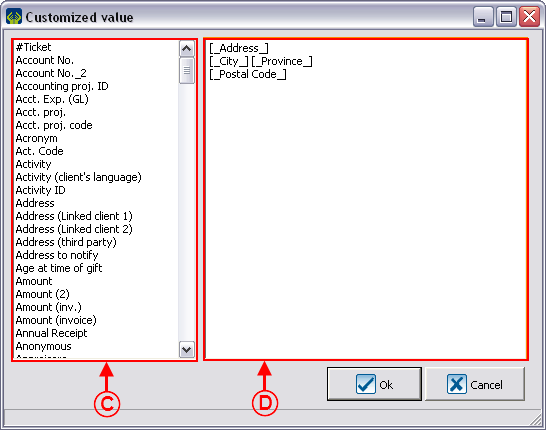
A customized value is used to include several fields in the same column.
For instance, instead of displaying the "Address", "City", "Province" and "Postal code" fields on four columns, it is possible to display these four pieces of information in a configurable value.
| |
|
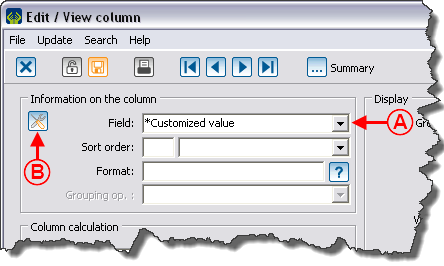
A: In the "Field" drop-down list, select "*Customized value". |
B: After selecting the "*Customized value" field, the |
Example of Customized Value
 |
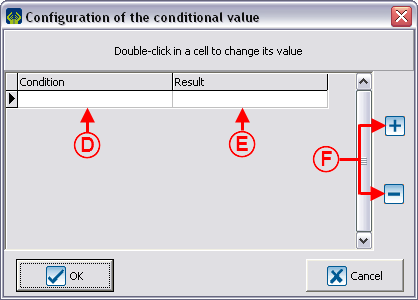
Conditional Value
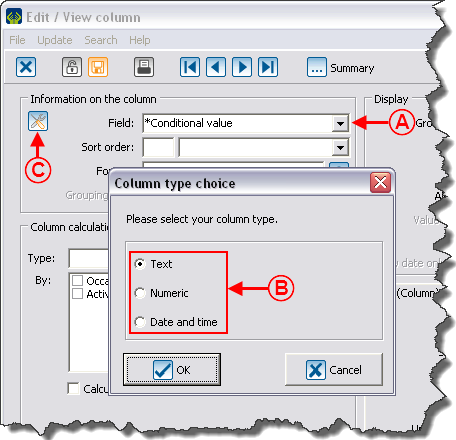
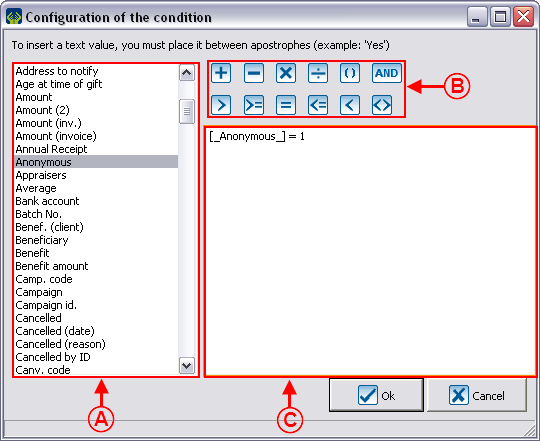
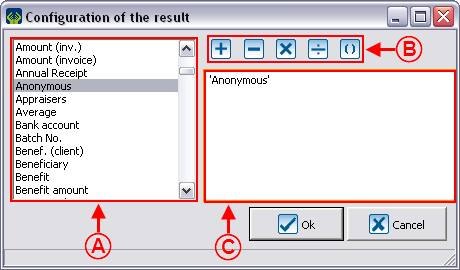
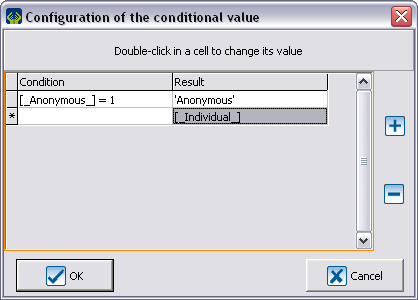
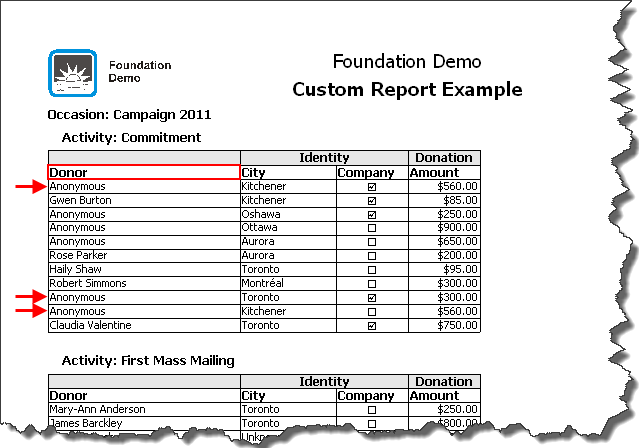
A conditional value displays a piece of information based on the response to a given condition.
For instance, if a client is anonymous, the mention "Anonymous" must appear in the column, otherwise the donor's name must be entered.
Example of Report with a Conditional Value
 |
|
In this example, the conditional value was named "Donor". |
Calculation Function
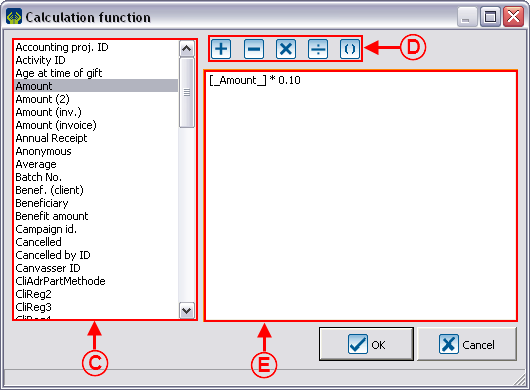
A "Calculation function" is a mathematical operation allowing you to obtain a precise result.
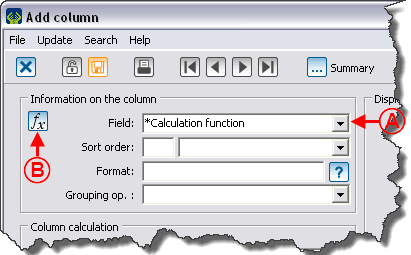
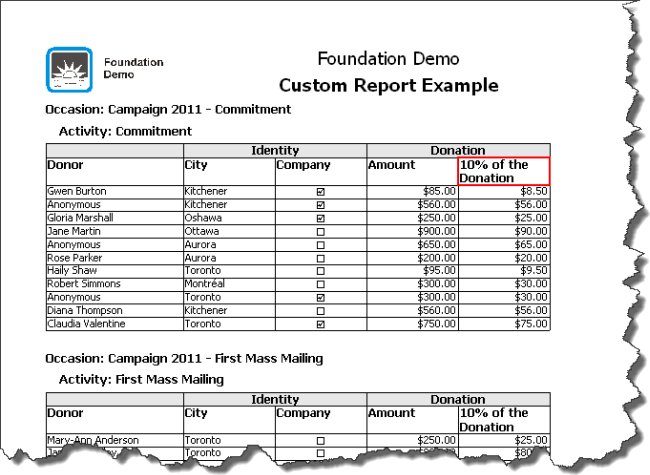
For instance, it is possible to take the "Amount" field and to multiply it by 0.10 to obtain a column that displays 10% of the value of the amounts of the transaction.
| |
|
A: In the "Field" drop-down list, select "*Calculation function". |
B: After selecting the "*Calculation function" field, the |
Example of the "Calculation Function" Field
|
|
In this example, the "Calculation function" field was named "10% of the Donation". |
Using the Option "This report is a grouping"
This option activates when configuring the visual options and displays several lines of the grid in one single line in the report. In order to be grouped, the lines must contain an identical piece of information in all the columns used in the report, except for the columns on which a grouping operation is performed.
There are six different types of operations available:
Average: Calculates the average of the existing values (does not consider empty lines).
For example, if the values are: "2", "Empty", "Empty" and "4", the result will be "3".
Number: Counts the number of lines (does not consider empty lines).
For example, if the values are: "1", "0", "Empty" and "2", the result will be "3".
Maximum: Indicates the greatest existing value.
Minimum: Indicates the smallest existing value (does not consider empty lines).
Amount: Adds the values.
Number of distinct values: Calculates the number of different values (considers empty lines).
For example, if the values are: "1", "Empty", "1" and "3", the result will be "3".
CAUTION: Do not confuse these operations with the ones of the "Column Calculation" section.
Example of an Onscreen Search
|
|
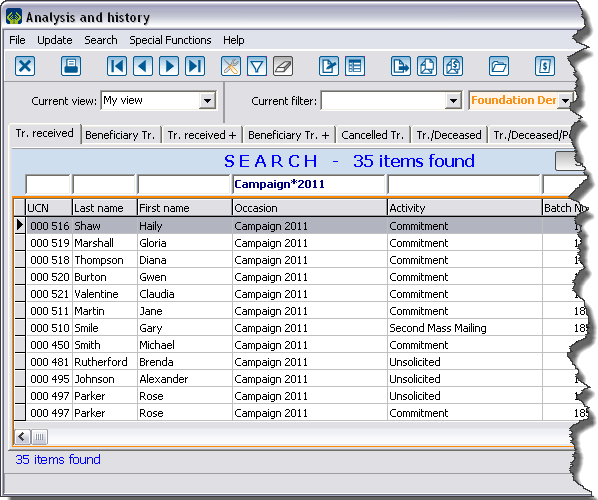
A manual count allows you to find:
|
Result of the Onscreen Search
|
|
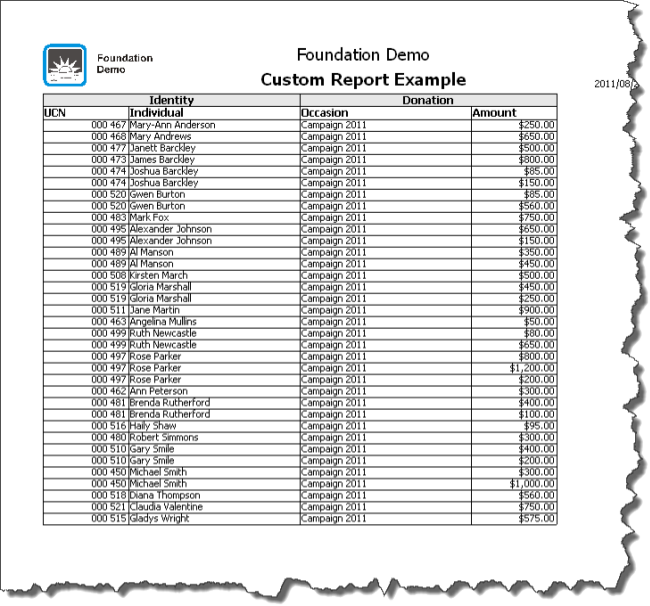
In this report, the columns "UCN", "Individual"' "Occasion" and "Amount" are displayed. Furthermore, a grouping operation was made on the "Amount" field. |
Document name: ProDon:Custom Reports
