Difference between revisions of "ProDon:Custom Reports"
| Line 535: | Line 535: | ||
=== Adding Separations to the Report === | === Adding Separations to the Report === | ||
| − | Adding separations allows you to section the report based on a specific piece of information. The sectioning is done each time the report meets a new piece of information. | + | Adding separations allows you to section the report based on a specific piece of information. The sectioning is done each time the report meets a new piece of information. |
{| width="50%" cellspacing="1" cellpadding="1" border="1" class="wikitable" | {| width="50%" cellspacing="1" cellpadding="1" border="1" class="wikitable" | ||
|- | |- | ||
| colspan="2" | | | colspan="2" | | ||
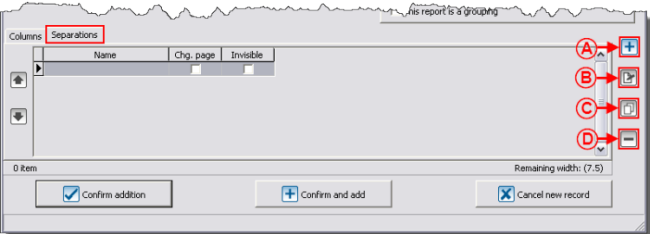
| − | To add a separation to a report, click on the [[Image: | + | To add a separation to a report, click on the [[Image:Button add plus.png]] button in the "Separations" tab that is at the bottom of the "Add custom report" window. |
|- | |- | ||
| − | | colspan="2" | [[Image: | + | | colspan="2" | [[Image:Custom Reports 016.png]] |
|- | |- | ||
| width="50%" | | | width="50%" | | ||
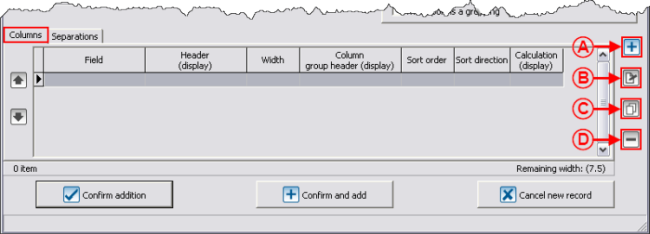
| − | '''<span style="color: rgb(255, 0, 0);">A: </span>'''Allows you to add a new separation to the report. | + | '''<span style="color: rgb(255, 0, 0);">A: </span>'''Allows you to add a new separation to the report. |
| width="50%" | | | width="50%" | | ||
| − | '''<span style="color: rgb(255, 0, 0);">B: </span>'''Allows you to modify an existing separation. | + | '''<span style="color: rgb(255, 0, 0);">B: </span>'''Allows you to modify an existing separation. |
|- | |- | ||
| width="50%" | | | width="50%" | | ||
| − | '''<span style="color: rgb(255, 0, 0);">C: </span>'''Allows you to duplicate an existing separation. | + | '''<span style="color: rgb(255, 0, 0);">C: </span>'''Allows you to duplicate an existing separation. |
| width="50%" | | | width="50%" | | ||
| − | '''<span style="color: rgb(255, 0, 0);">D: </span>'''Allows you to delete a separation from the report. | + | '''<span style="color: rgb(255, 0, 0);">D: </span>'''Allows you to delete a separation from the report. |
|} | |} | ||
| Line 565: | Line 565: | ||
|- | |- | ||
| colspan="2" | | | colspan="2" | | ||
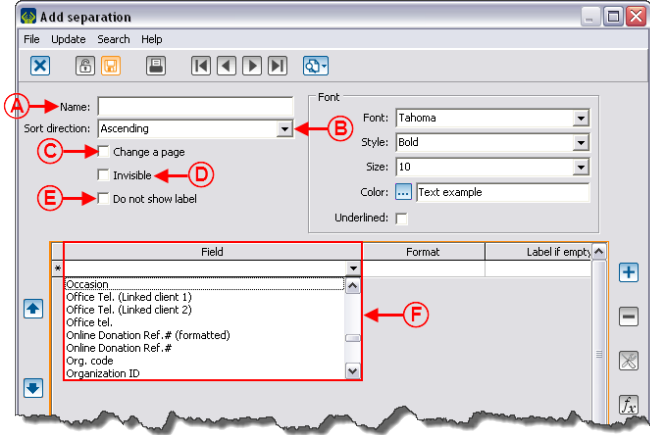
| − | After clicking on the [[Image: | + | After clicking on the [[Image:Button add plus.png]] button, this window opens. '''For all the following examples concerning the separations, refer to section "Examples of Separations".''' |
|- | |- | ||
| − | | colspan="2" | [[Image: | + | | colspan="2" | [[Image:Custom Reports 017.png]] |
|- | |- | ||
| width="50%" | | | width="50%" | | ||
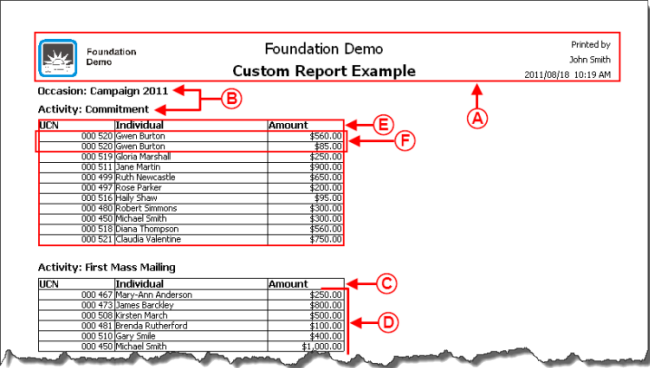
| − | '''<span style="color: rgb(255, 0, 0);">A: </span>'''Allows you to choose a label for the separation. To view an example of named separation, see letter '''<span style="color: rgb(255, 0, 0);">A</span>'''. | + | '''<span style="color: rgb(255, 0, 0);">A: </span>'''Allows you to choose a label for the separation. To view an example of named separation, see letter '''<span style="color: rgb(255, 0, 0);">A</span>'''. |
| width="50%" | | | width="50%" | | ||
| − | '''<span style="color: rgb(255, 0, 0);">B: </span>'''Allows you to decide whether the separations will be sorted in ascending or descending order. To view an example of ascending sorting order, see letter '''<span style="color: rgb(255, 0, 0);">B</span>'''. | + | '''<span style="color: rgb(255, 0, 0);">B: </span>'''Allows you to decide whether the separations will be sorted in ascending or descending order. To view an example of ascending sorting order, see letter '''<span style="color: rgb(255, 0, 0);">B</span>'''. |
|- | |- | ||
| width="50%" | | | width="50%" | | ||
| − | '''<span style="color: rgb(255, 0, 0);">C: </span>'''Allows you to change page between each separation. To view an exampleof page change between separations, see letter '''<span style="color: rgb(255, 0, 0);">C</span>'''. | + | '''<span style="color: rgb(255, 0, 0);">C: </span>'''Allows you to change page between each separation. To view an exampleof page change between separations, see letter '''<span style="color: rgb(255, 0, 0);">C</span>'''. |
| width="50%" | | | width="50%" | | ||
| − | '''<span style="color: rgb(255, 0, 0);">D: </span>'''Allows you to insert a separation without displaying it in the report. To view an example of invisible separation, see letter '''<span style="color: rgb(255, 0, 0);">D</span>'''. | + | '''<span style="color: rgb(255, 0, 0);">D: </span>'''Allows you to insert a separation without displaying it in the report. To view an example of invisible separation, see letter '''<span style="color: rgb(255, 0, 0);">D</span>'''. |
|- | |- | ||
| width="50%" | | | width="50%" | | ||
| − | '''<span style="color: rgb(255, 0, 0);">E: </span>'''Allows you not to display the name given in '''<span style="color: rgb(255, 0, 0);">A</span>'''. To view an example of separation without label, see letter '''<span style="color: rgb(255, 0, 0);">E</span>'''. | + | '''<span style="color: rgb(255, 0, 0);">E: </span>'''Allows you not to display the name given in '''<span style="color: rgb(255, 0, 0);">A</span>'''. To view an example of separation without label, see letter '''<span style="color: rgb(255, 0, 0);">E</span>'''. |
| width="50%" | | | width="50%" | | ||
| − | '''<span style="color: rgb(255, 0, 0);">F: </span>'''Allows you to specify on which field the separation has to be based. To add more than one, click on the [[Image: | + | '''<span style="color: rgb(255, 0, 0);">F: </span>'''Allows you to specify on which field the separation has to be based. To add more than one, click on the [[Image:Button add plus.png]] button on the right. To view an example of separation containing two fields, see letter '''<span style="color: rgb(255, 0, 0);">F</span>'''. |
|- | |- | ||
| colspan="2" | | | colspan="2" | | ||
| − | '''NOTE:''' Separations can cause errors if they are misinterpreted. For instance, the "Client" field contains the piece of information "Company name" '''OR''' "Name" '''AND''' "First name". So, if two clients have exactly the same last name and first name, they will be grouped because the information of the "Client" field is the same. Therefore, it is wise to separate the clients by "UCN" because it is impossible that two clients have the same "UCN". | + | '''NOTE:''' Separations can cause errors if they are misinterpreted. For instance, the "Client" field contains the piece of information "Company name" '''OR''' "Name" '''AND''' "First name". So, if two clients have exactly the same last name and first name, they will be grouped because the information of the "Client" field is the same. Therefore, it is wise to separate the clients by "UCN" because it is impossible that two clients have the same "UCN". |
|} | |} | ||
Revision as of 11:32, 19 August 2011
Contents
[hide]- 1 Introduction
- 2 Managing the Reports Available
- 3 Creation of a Custom Report
Introduction
The custom reports tool allows you to create reports from a search conducted previously.
Firstly, it is important to know that:
- It is possible to create a custom report from all the management grids in which the report icon
 is active (blue).
 - A report is always attached to a precise management grid. For instance, if it is created in the "Transaction management", it doesn't appear in the "Client management".
- The fields available for the creation of a report are the same as the ones in the corresponding management grid (columns).
- It is possible to include summaries to the reports only from the "Client management" and "Analysis & History".
- Each management grid contains files (e.g. the client file in the "Client management" grid) and it is possible to generate an existing report from each of these files. However, it is not possible to create a new one.
Managing the Reports Available
First of all, go in the management proper to the type of report you want to create, modify or delete.
|
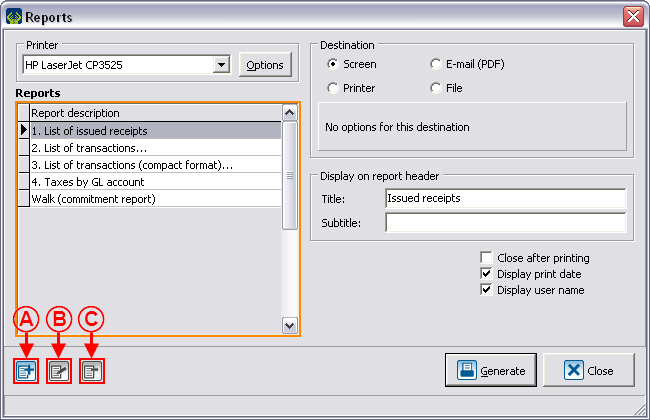
This window opens. | |
| |
|
NOTE: The reports provided by Logilys are not modifiable nor deletable. | |
Creation of a Custom Report
Go to the management proper to the type of report you want to create.
Conduct a search by criterion using the search bar, so that the management grid corresponds to what should be found on the report.
Once the management grid corresponds to what should be found on the report, click on the ![]() button.
button.
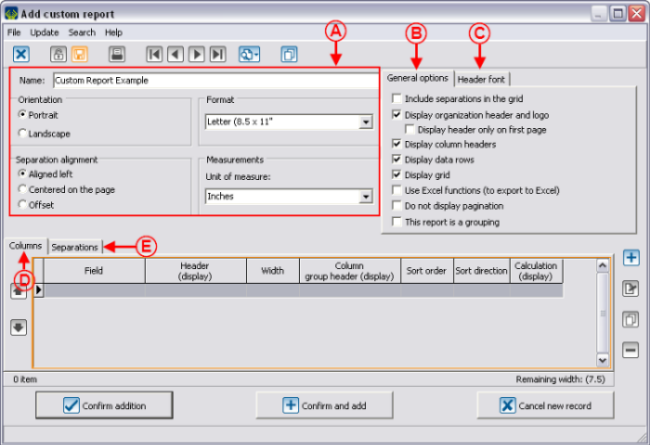
To create a new report, click on the ![]() button.
button.
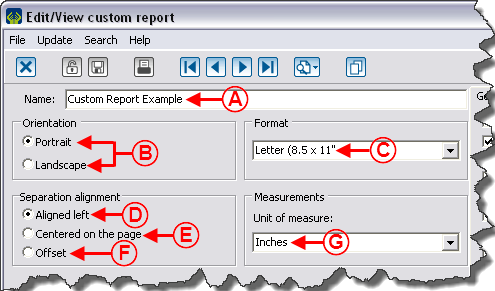
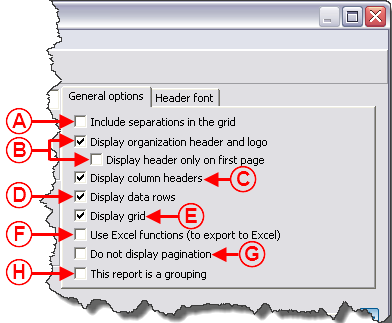
Configuration of the Visual Options
Examples of Visual Options
First Example
Second Example
Third Example
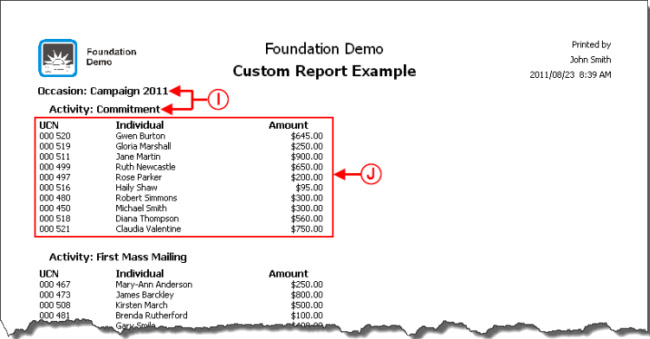
| |
|
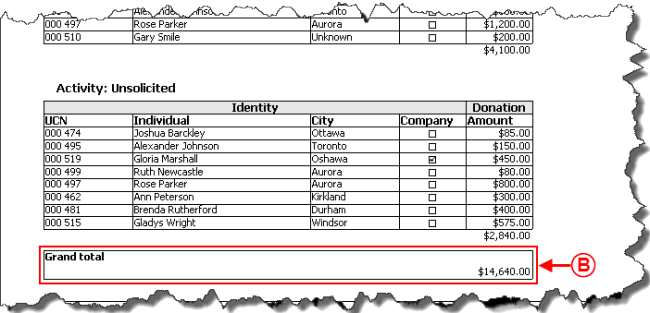
I: Example of report where the separations are offset. |
J: Example of report where the option "Display grid" is not checked. |
Adding Columns to the Report
Information on the Column
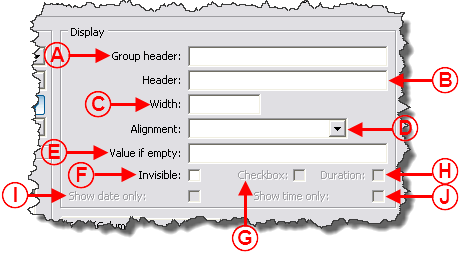
Display
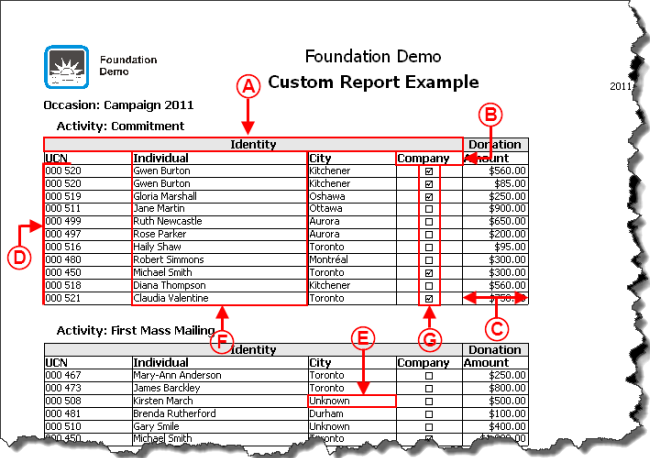
Examples of Display
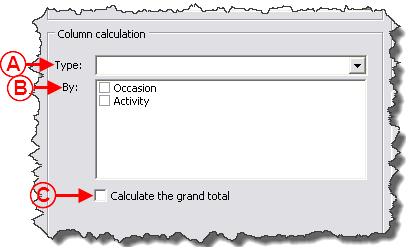
Calculation on Column
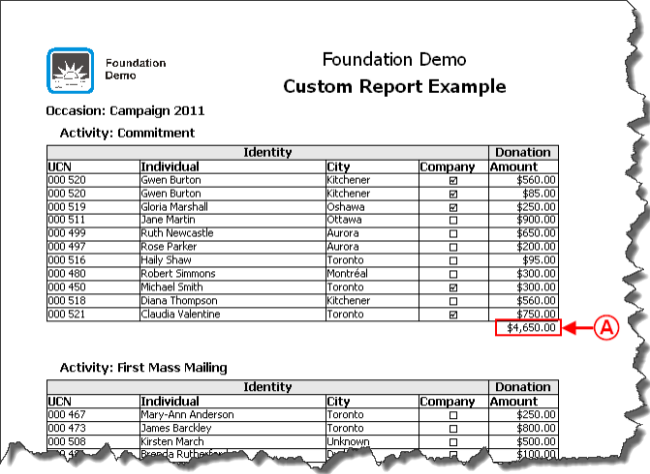
Example of Calculation on Column
Adding Separations to the Report
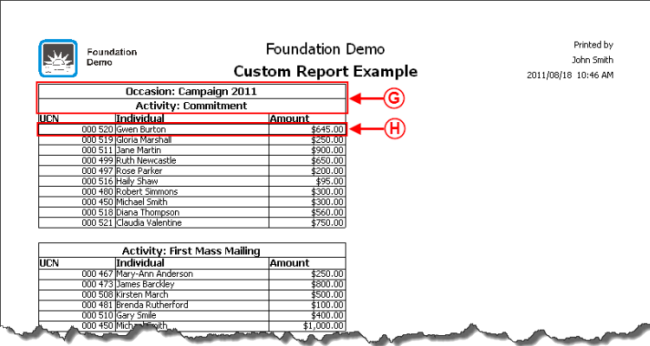
Adding separations allows you to section the report based on a specific piece of information. The sectioning is done each time the report meets a new piece of information.
Examples of Separations
Configurable Value
Example of Configurable Value
Conditional Value
Example of Report with a Conditional Value
Calculation Function
Example of the "Calculation Function" Field
Using the Option "This report is a grouping"
Example of an Onscreen Search
Result of the Onscreen Search
Document name: ProDon:Custom Reports
