Difference between revisions of "ProDon:Analysis Summary"
| (2 intermediate revisions by 2 users not shown) | |||
| Line 1: | Line 1: | ||
| − | {{ | + | {{Header_TOC}}<br> |
<br> | <br> | ||
| + | |||
| + | '''<u>CAUTION</u>''' : This document is for '''VERSION''' '''5''' of '''''Prodon'''''. To go to the document for version 4, [[ProDon:Analysis_Summary (Version 4)|click here]]. | ||
| + | |||
| + | <br><span style="color: rgb(255, 0, 0);">'''WARNING : This document is currently being edited/revised, it is possible that some parts are missing or obsolete.'''</span> | ||
| + | |||
| + | |||
== Introduction<br> == | == Introduction<br> == | ||
| Line 20: | Line 26: | ||
When the search is done, click on the [[Image:Button Summary detail.png]] button at the top of "Analysis and history", to display the summaries.<br> | When the search is done, click on the [[Image:Button Summary detail.png]] button at the top of "Analysis and history", to display the summaries.<br> | ||
| − | {| | + | {| width="651" cellspacing="1" cellpadding="1" border="1" class="wikitable" |
|- | |- | ||
| colspan="2" | | | colspan="2" | | ||
| Line 38: | Line 44: | ||
<br> | <br> | ||
| − | {| | + | {| width="656" cellspacing="1" cellpadding="1" border="1" class="wikitable" |
|- | |- | ||
| colspan="2" | | | colspan="2" | | ||
| Line 61: | Line 67: | ||
<br> | <br> | ||
| − | {| | + | {| width="656" cellspacing="1" cellpadding="1" border="1" class="wikitable" |
|- | |- | ||
| colspan="2" | | | colspan="2" | | ||
| Line 77: | Line 83: | ||
|} | |} | ||
| − | <br> | + | <br> |
== Exporting Summaries to '''''Excel'''''<br> == | == Exporting Summaries to '''''Excel'''''<br> == | ||
| Line 85: | Line 91: | ||
=== "Summaries" Tab<br> === | === "Summaries" Tab<br> === | ||
| − | {| | + | {| cellspacing="1" cellpadding="1" border="1" style="width: 463px; height: 572px;" class="wikitable" |
|- | |- | ||
| colspan="2" | | | colspan="2" | | ||
| Line 110: | Line 116: | ||
=== "Columns" Tab<br> === | === "Columns" Tab<br> === | ||
| − | {| | + | {| cellspacing="1" cellpadding="1" border="1" style="width: 375px; height: 330px;" class="wikitable" |
|- | |- | ||
| colspan="2" | [[Image:Analysis Summary 005.png]]<br> | | colspan="2" | [[Image:Analysis Summary 005.png]]<br> | ||
| Line 135: | Line 141: | ||
=== "Cumulative periods" Tab === | === "Cumulative periods" Tab === | ||
| − | {| | + | {| cellspacing="1" cellpadding="1" border="1" class="wikitable" style="width: 377px; height: 382px;" |
|- | |- | ||
| colspan="2" | | | colspan="2" | | ||
| Line 157: | Line 163: | ||
=== "Options" Tab === | === "Options" Tab === | ||
| − | {| | + | {| cellspacing="1" cellpadding="1" border="1" style="width: 459px; height: 303px;" class="wikitable" |
|- | |- | ||
| colspan="2" | [[Image:Analysis Summary 007.png]] | | colspan="2" | [[Image:Analysis Summary 007.png]] | ||
| Line 180: | Line 186: | ||
The '''''Excel''''' functions can lead to '''misinterpretations''' if they are misused. Here is an example of common error: | The '''''Excel''''' functions can lead to '''misinterpretations''' if they are misused. Here is an example of common error: | ||
| − | {| | + | {| width="656" cellspacing="1" cellpadding="1" border="1" class="wikitable" |
|- | |- | ||
| colspan="2" | [[Image:Analysis Summary 008.png]] | | colspan="2" | [[Image:Analysis Summary 008.png]] | ||
| Line 194: | Line 200: | ||
<br> | <br> | ||
| − | {| | + | {| cellspacing="1" cellpadding="1" border="1" class="wikitable" style="width: 515px; height: 264px;" |
|- | |- | ||
| [[Image:Analysis Summary 009.png]] | | [[Image:Analysis Summary 009.png]] | ||
| Line 207: | Line 213: | ||
<br> | <br> | ||
| − | {{ | + | {{Footer_ProDon_Version|4.6.5.8}}<br> |
Latest revision as of 14:30, 17 May 2019
| Analysis Summary |
CAUTION : This document is for VERSION 5 of Prodon. To go to the document for version 4, click here.
WARNING : This document is currently being edited/revised, it is possible that some parts are missing or obsolete.
Introduction
The "Analysis and history" management contains all the transacions of the database. It is common to wish to highlight information for analysis purposes. Many of these analyses are possible thanks to the summaries available. For example:
- How many different clients were there for the 1,000 transactions of a targeted donation occasion?
- What is the distribution per city of these 1,000 transactions?
- What is the total amount of all the transactions of a targeted year?
- ...
Viewing Summaries
The summaries are always calculated based on the active list. The active list is the result of a search or a filter. For instance, if you want to compare the information of several editions of golf tournaments, you first have to conduct a search. This search allows you to view, onscreen only, the transactions attached to one of the golf tournaments. It is possible to search using the search bar or by making a filter.
When the search is done, click on the ![]() button at the top of "Analysis and history", to display the summaries.
button at the top of "Analysis and history", to display the summaries.
|
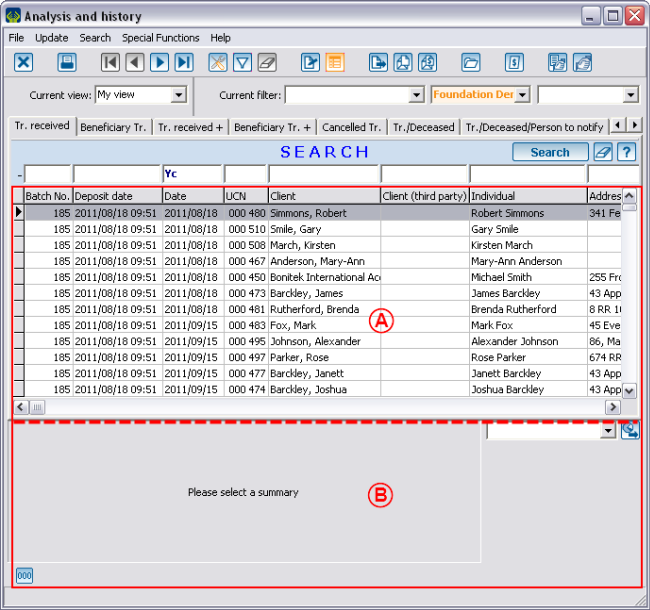
After clicking on the | |
 | |
|
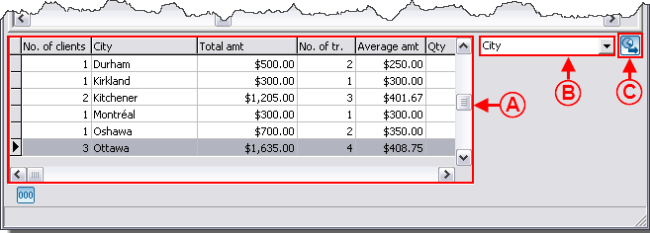
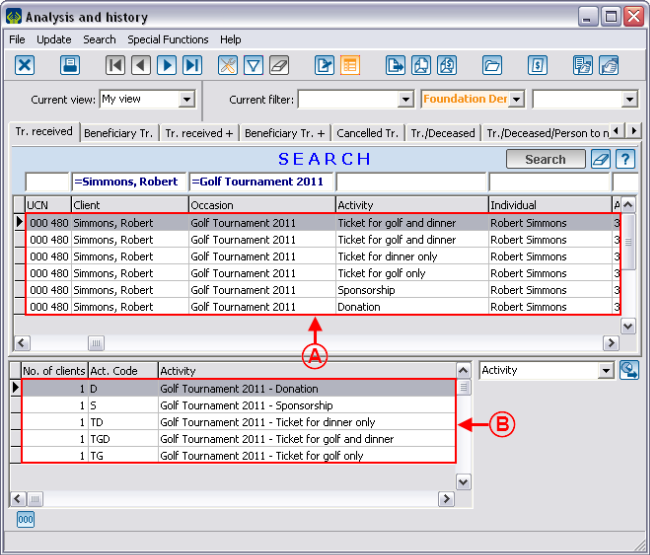
A: The top part contains the active list. |
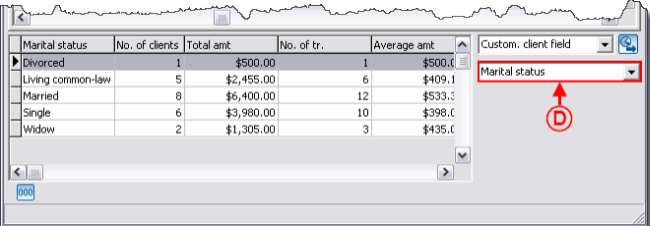
B: The bottom part allows you to select the analysis summary. |
Exporting Summaries to Excel
It is possible to export the result of the summary using the ![]() button.
button.
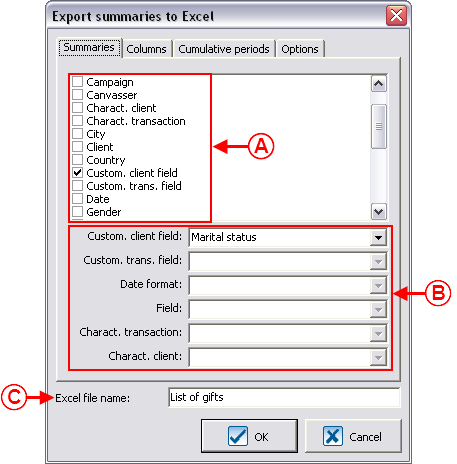
"Summaries" Tab
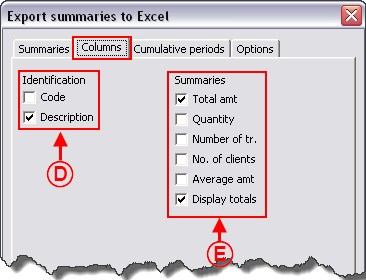
"Columns" Tab
"Cumulative periods" Tab
|
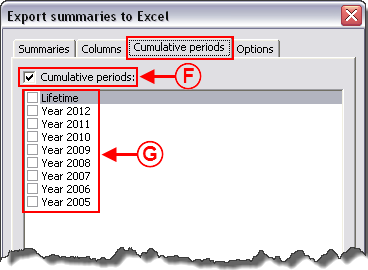
This tab allows you to make summaries on precise periods. Each checked period adds a column per "Summary" checked in the "Columns" tab. For more details concerning period management, consult this document. | |
| |
|
F: This box must be checked so that the periods in G become accessible. If this box is not checked, the periods are shaded. |
G: These are all the periods present in the database. To know how to create new ones, consult the "Period management" procedure. |
"Options" Tab
Excel Functions on Summaries
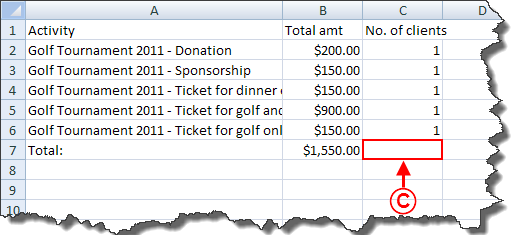
The Excel functions can lead to misinterpretations if they are misused. Here is an example of common error:
|
|
C: In Excel, if you make the total at line 7 of column C (number of clients), the result would be 5, while there is only one client (see point A). |
Document name: ProDon:Analysis Summary
Version : 4.6.5.8
